Fig. 8
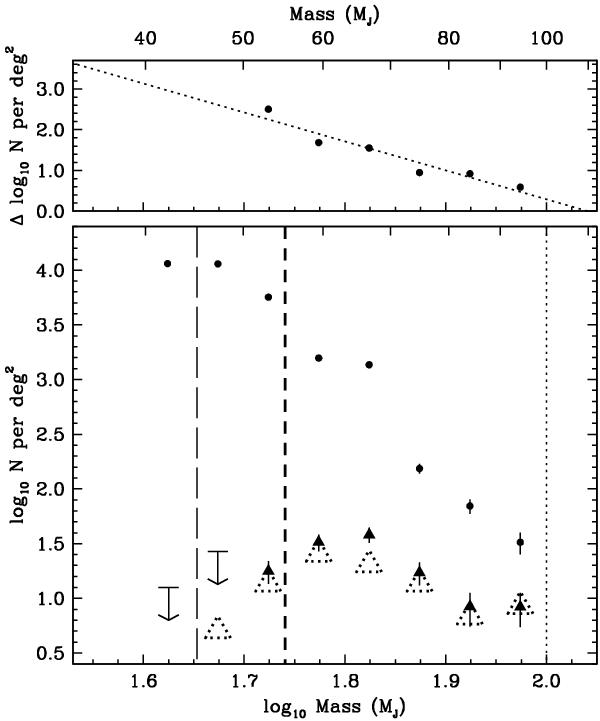
Lower panel. Mass function based on a) the LBT i and z photometry (filled dots) after detection efficiency corrections, and b) the LBT photometry plus the J and Ks photometry from Boudreault et al. (2010) (dotted open triangles: the original MF; filled triangles: the MF after detection efficiency corrections and removing contaminants). The selection and mass calibration are based on dusty atmospheres. Error bars are Poissonian arising from the number of objects in each bin, except for the lowest-mass bin, for which the error bar is from the linear fit in the top panel. The vertical thin dotted lines are the mass limits at which detector saturation occurs in the i and z-bands. The vertical thin long dashed line is the mass at the 5σ detection limit of our optical LBT data while the thick short dashed line is the mass at the 5σ detection limit of the NIR data of Boudreault et al. (2010). Top panel. Difference of the log of the number of objects (in each mass bin) between the MF computed using the optical iz data and the MF computed using both iz and NIR JKs data from Boudreault et al. (2010). The dotted line is a linear fit.
Current usage metrics show cumulative count of Article Views (full-text article views including HTML views, PDF and ePub downloads, according to the available data) and Abstracts Views on Vision4Press platform.
Data correspond to usage on the plateform after 2015. The current usage metrics is available 48-96 hours after online publication and is updated daily on week days.
Initial download of the metrics may take a while.