Fig. 5
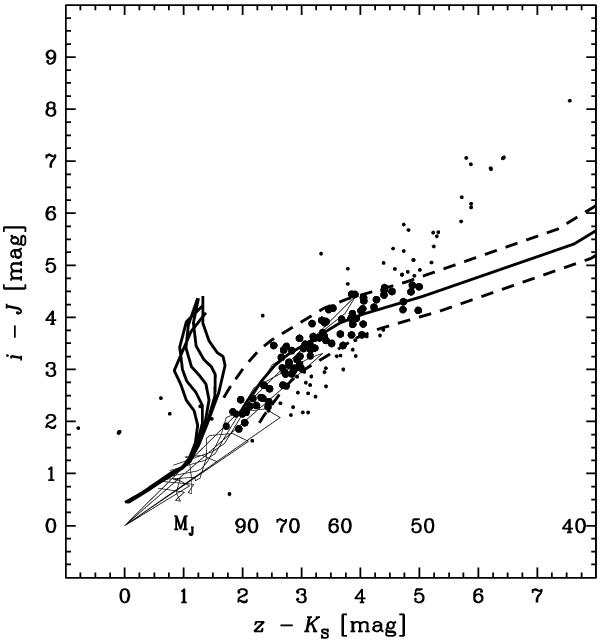
Colour-colour diagram used in the second selection step. The solid line is the isochrone computed from an evolutionary model with a dusty atmosphere (the AMES-Dusty model; the masses in M⊙ for each z − Ks colour are shifted for clarity). The dashed lines show our selection area. We also show the theoretical colours of six galaxies as thin lines and the theoretical colours of red giants as thick lines. The six galaxies are two starbursts, one Sab, one Sbc, and two ellipticals of 5.5 and 15 Gyr, with redshifts from z = 0 to z = 2 in steps of 0.25 (evolution not considered). We assume that all red giants have a mass of 5 M⊙, 0.5 < log g < 2.5 and 2000 K < Teff < 6000 K.
Current usage metrics show cumulative count of Article Views (full-text article views including HTML views, PDF and ePub downloads, according to the available data) and Abstracts Views on Vision4Press platform.
Data correspond to usage on the plateform after 2015. The current usage metrics is available 48-96 hours after online publication and is updated daily on week days.
Initial download of the metrics may take a while.