Free Access
Fig. 3
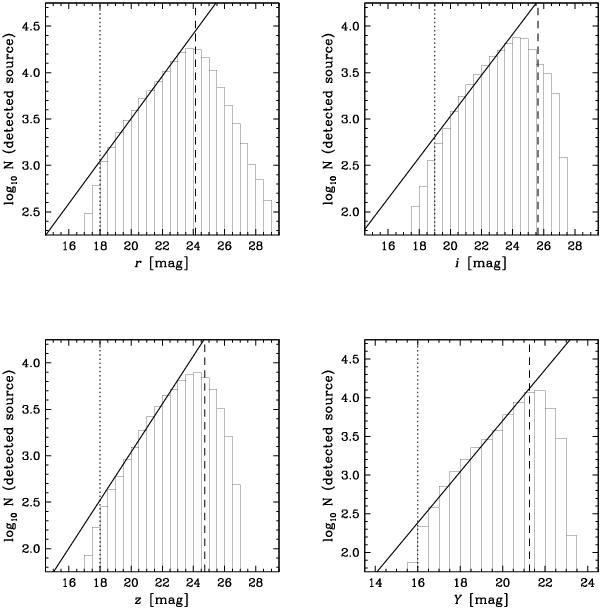
Estimation of the completeness limit for our survey using the iz bands. The solid lines are the best linear fits before the turn offs. The vertical dashed lines are the 5σ detection limit and the vertical dotted lines are the saturation magnitudes.
Current usage metrics show cumulative count of Article Views (full-text article views including HTML views, PDF and ePub downloads, according to the available data) and Abstracts Views on Vision4Press platform.
Data correspond to usage on the plateform after 2015. The current usage metrics is available 48-96 hours after online publication and is updated daily on week days.
Initial download of the metrics may take a while.