Fig. 5
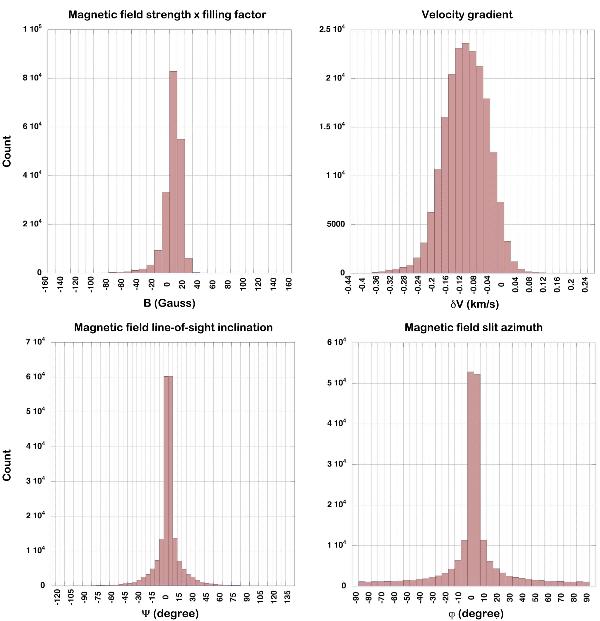
Accuracy of the UNNOFIT inversion (CaI 6103 line: histograms of the differences between the UNNOFIT output values and the input ones of a series of synthetic profiles. For each ensemble of input values, a set of theoretical profiles has been computed, noised, and then inverted, leading to the output values. Histograms have been plotted for 1) the local average magnetic field strength, which is the product of the magnetic field strength by the magnetic filling factor; 2) the local velocity gradient; 3) the line of sight inclination angle; and 4) the slit’s azimuth angle.
Current usage metrics show cumulative count of Article Views (full-text article views including HTML views, PDF and ePub downloads, according to the available data) and Abstracts Views on Vision4Press platform.
Data correspond to usage on the plateform after 2015. The current usage metrics is available 48-96 hours after online publication and is updated daily on week days.
Initial download of the metrics may take a while.