Fig. 1
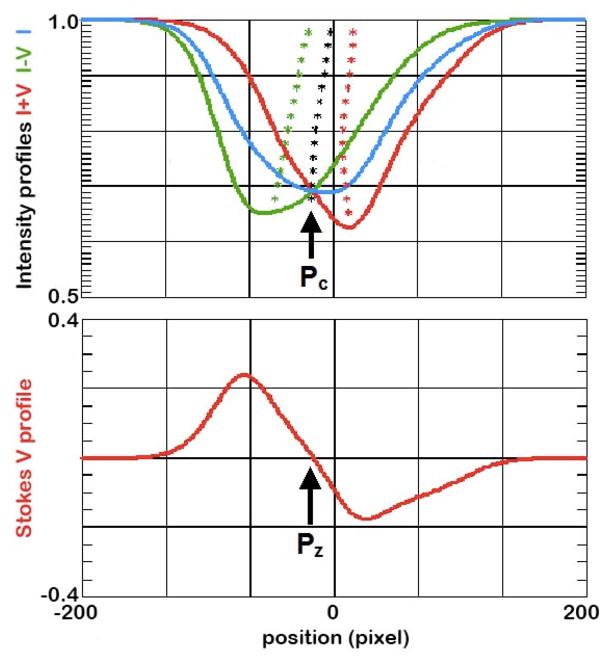
Top: modeling of I + V (red curve) and I − V (green curve) for Fe i 6301.5 Å in the presence of a magnetic field and velocity gradient (here η0 = 0.8, ξ = 50, B = 1000 G, ψ = 60o, and δv = −800 m s-1. The blue curve is for the I Stokes. The plotted stars define the bisector positions derived at different depths in the profiles, and the black stars represent the bisector half summation. Pc is the intersection point between I + V and I − V that is distinct from the I Stokes minimum. Bottom: modeling of the corresponding V Stokes. Pz is the position of the Stokes V zerocrossing.
Current usage metrics show cumulative count of Article Views (full-text article views including HTML views, PDF and ePub downloads, according to the available data) and Abstracts Views on Vision4Press platform.
Data correspond to usage on the plateform after 2015. The current usage metrics is available 48-96 hours after online publication and is updated daily on week days.
Initial download of the metrics may take a while.