Free Access
Fig. 2
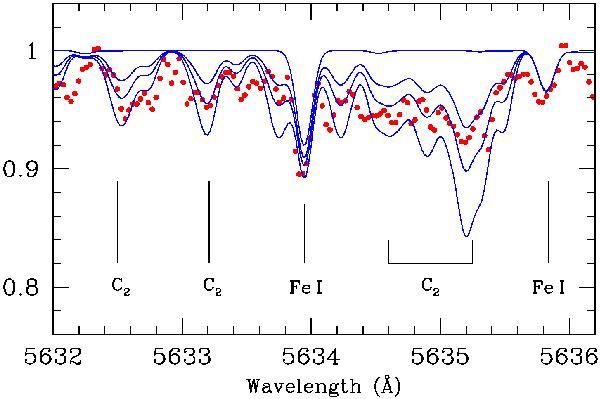
Observed (dotted red line) and synthetic (solid blue line) spectra in the region around the C2 molecule lines at 5635 Å. We show the synthesis for the carbon abundances log ε(C) = 7.16, 7.21, and 7.26. The upper line corresponds to the spectrum calculated without any contribution from the C2 lines.
Current usage metrics show cumulative count of Article Views (full-text article views including HTML views, PDF and ePub downloads, according to the available data) and Abstracts Views on Vision4Press platform.
Data correspond to usage on the plateform after 2015. The current usage metrics is available 48-96 hours after online publication and is updated daily on week days.
Initial download of the metrics may take a while.