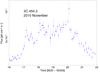
Fig. 3
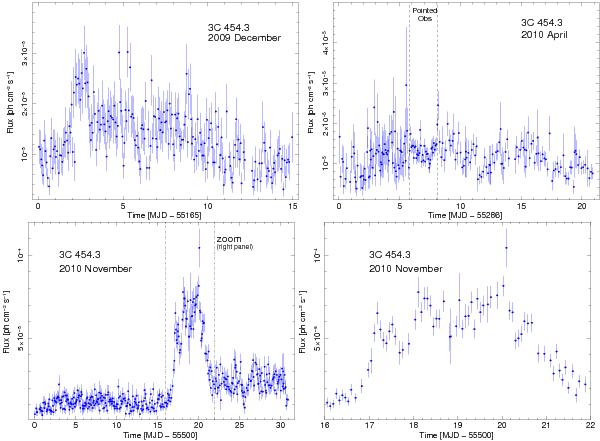
Light curves of 3C 454.3 (E > 100 MeV). (Top left panel) 2009 December: time starts on 2009 November 30 (MJD 55 165), so that the days indicated in abscissa corresponds also to the days of December. (Top right panel) 2010 April: time starts on 2010 March 31 (MJD 55 286), so that the days indicated in abscissa corresponds also to the days of April. The time region between the two dashed lines is that when the pointed observation was done (2010 April 5−8). It is clearly evident that the error bars are smaller than those in scanning mode, as a consequence of the better performances of the instrument. (Bottom left panel) 2010 November: time starts on 2010 October 31 (MJD 55 500), so that the days indicated in abscissa corresponds also to the days of November. (Bottom right panel) 2010 November: zoom of the figure of the bottom left panel centered in the period of the highest activity (2010 November 16−22), when 3C 454.3 reached the peak of ~10-4 ph cm-2 s-1. Time bins are of the order of a few thousands of seconds and are too small to be visible.
Current usage metrics show cumulative count of Article Views (full-text article views including HTML views, PDF and ePub downloads, according to the available data) and Abstracts Views on Vision4Press platform.
Data correspond to usage on the plateform after 2015. The current usage metrics is available 48-96 hours after online publication and is updated daily on week days.
Initial download of the metrics may take a while.