Fig. 2
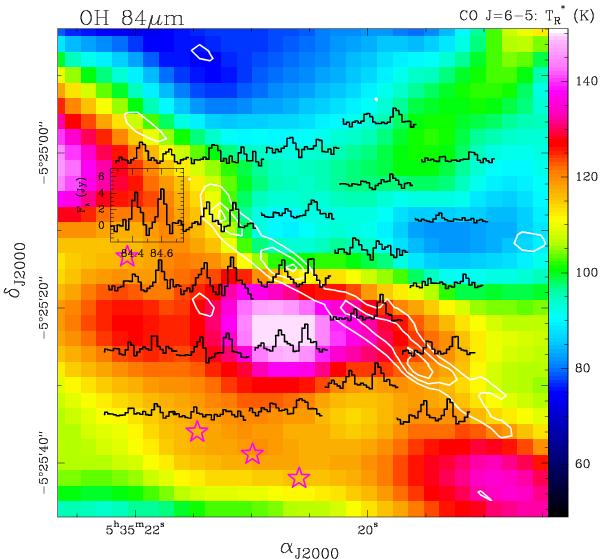
PACS rotationally excited OH  J = 7/2 → 5/2 lines at ~84 μm (Eu/k = 291 K) overlaid on the distribution of the CO J = 6–5 peak brightness temperature (colour image) observed with the CSO telescope at ~11′′ resolution (Lis et al. 1998). White contours show the brightest regions of H
 v = 1–0 S(1) emission (Walmsley et al. 2000). Lower intensity H extended emission is present in the entire field (van der Werf et al. 1996). Violet stars shows the position of the H13CN J = 1–0 clumps deeper inside the Bar (Lis & Schilke 2003). Note the decrease of OH line intensity with distance from the ionization front.
Current usage metrics show cumulative count of Article Views (full-text article views including HTML views, PDF and ePub downloads, according to the available data) and Abstracts Views on Vision4Press platform.
Data correspond to usage on the plateform after 2015. The current usage metrics is available 48-96 hours after online publication and is updated daily on week days.
Initial download of the metrics may take a while.