Fig. 1
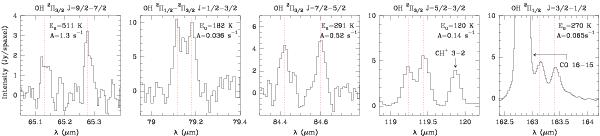
OH (X 2Π; ν = 0) rotational lines detected with Herschel/PACS towards the α2000 ≃ 5h35m21.9s, δ2000 ≃ −5°25′06.7′′ position where the higher excitation OH line peak is observed (see Fig. 2). The red dotted lines show the expected wavelength for each Λ-doublet (see Fig. B.1 in Appendix B for a complete OH rotational energy diagram). Small intensity asymmetries are observed in most OH Λ-doublets. Transition upper level energies and Aij spontaneous transition probabilities are indicated.
Current usage metrics show cumulative count of Article Views (full-text article views including HTML views, PDF and ePub downloads, according to the available data) and Abstracts Views on Vision4Press platform.
Data correspond to usage on the plateform after 2015. The current usage metrics is available 48-96 hours after online publication and is updated daily on week days.
Initial download of the metrics may take a while.