Fig. 3
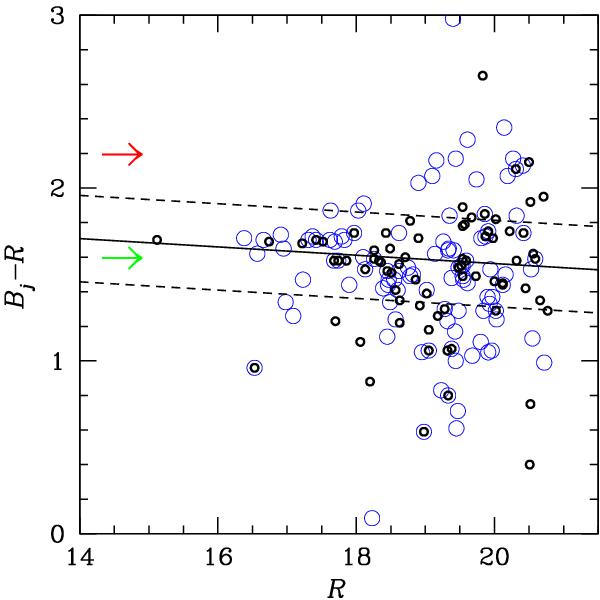
Bj–R vs. R diagram for galaxies extracted from the SSS. Small circles indicate galaxies within a radius of 4′from the BCG and used to fit the CMR (solid line). The dashed lines are drawn at ± 0.25 mag from the CMR to delimitate the region of “likely cluster members”. Large blue circles indicate galaxies within a radius of 4′from the SSW peak. The green and red arrows roughly indicate predicted colors for early-type galaxies at z = 0 and z = 0.2, respectively.
Current usage metrics show cumulative count of Article Views (full-text article views including HTML views, PDF and ePub downloads, according to the available data) and Abstracts Views on Vision4Press platform.
Data correspond to usage on the plateform after 2015. The current usage metrics is available 48-96 hours after online publication and is updated daily on week days.
Initial download of the metrics may take a while.