Fig. 1
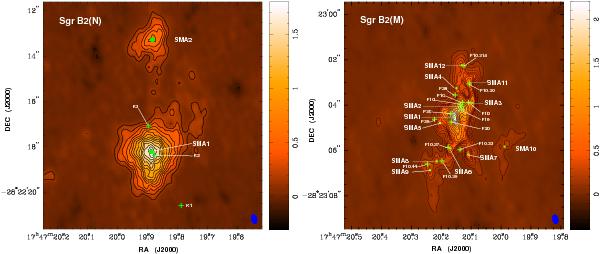
Continuum maps of Sgr B2 at 850 μm, with a synthesized beam of 0 24, PA = 14.4° (lower-right corner in each panel). The left panel shows the image of Sgr B2(N), with contour levels (− 1, 1, ...14) × 4σ (1σ = 0.031 Jy beam-1). The cross symbols indicate the positions of UC Hii regions detected in 1.3 cm continuum (Gaume et al. 1995). The right panel presents the image of Sgr B2(M), with contour levels (− 1, 1, 2, 3, 4, 4.5, 5.5, 5, 6, 7, 8, 10, ...28) × 4σ (1σ = 0.021 Jy beam-1). The cross symbols indicate the positions of UC Hii regions detected in 7 mm continuum (de Pree et al. 1998). In each panel, the filled circle symbols present the peak positions of the submillimeter continuum sources.
Current usage metrics show cumulative count of Article Views (full-text article views including HTML views, PDF and ePub downloads, according to the available data) and Abstracts Views on Vision4Press platform.
Data correspond to usage on the plateform after 2015. The current usage metrics is available 48-96 hours after online publication and is updated daily on week days.
Initial download of the metrics may take a while.