Free Access
Fig. 8
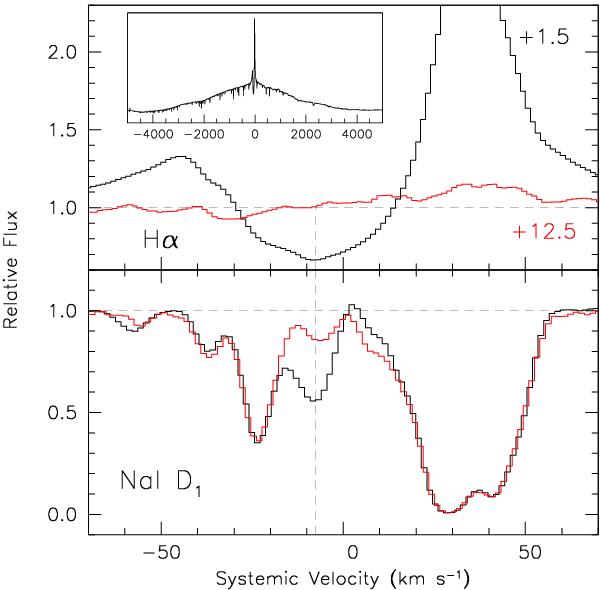
Comparison between the evolution of Hα (upper panel) and Na i D1 (lower panel) on the first two post-outburst epochs. The small insert in the upper panel shows the overall profile of the Hα line. The vertical dashed line marks the position of the time variable Na i D component #3.
Current usage metrics show cumulative count of Article Views (full-text article views including HTML views, PDF and ePub downloads, according to the available data) and Abstracts Views on Vision4Press platform.
Data correspond to usage on the plateform after 2015. The current usage metrics is available 48-96 hours after online publication and is updated daily on week days.
Initial download of the metrics may take a while.