Fig. 2
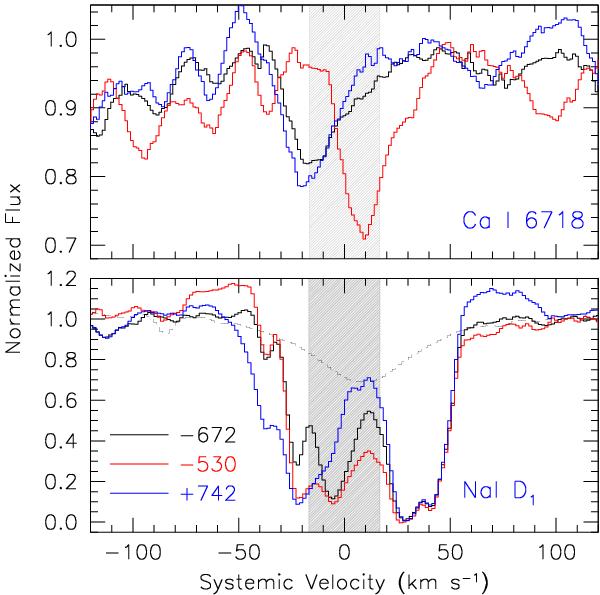
Time evolution for Na i D1 (lower panel) and Ca i λ6717.7 (upper panel) on three quiescence epochs (−672, −530 and +742). The vertical gray strip indicates the radial velocity range of the M giant during the orbital period (± 16.2 km s-1, Fekel et al. 2000). The dashed curve in the lower panel is the line profile of the K giant star HD 32887 (Da Silva et al. 2006), veiled to 30% of its original depth and placed at the velocity deduced from Ca i λ6718 for day −530.
Current usage metrics show cumulative count of Article Views (full-text article views including HTML views, PDF and ePub downloads, according to the available data) and Abstracts Views on Vision4Press platform.
Data correspond to usage on the plateform after 2015. The current usage metrics is available 48-96 hours after online publication and is updated daily on week days.
Initial download of the metrics may take a while.