Free Access
Fig. 5
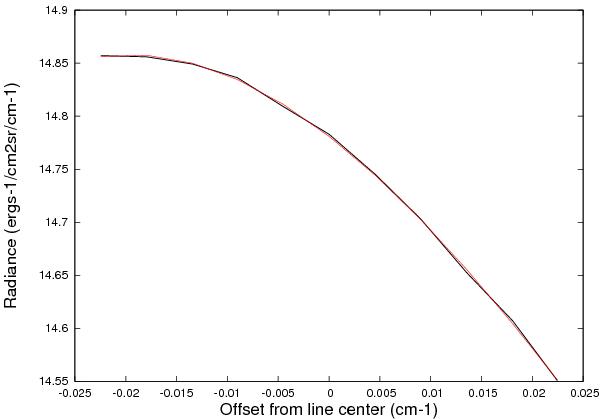
Black line: the disk-averaged TEXES spectrum (same as Fig. 1) coadded in the vicinity of the nine SO2 transitions listed in Table 1. All frequencies have been aligned on the zero frequency at the center of the figure. Red line: third order polynomial fit.
Current usage metrics show cumulative count of Article Views (full-text article views including HTML views, PDF and ePub downloads, according to the available data) and Abstracts Views on Vision4Press platform.
Data correspond to usage on the plateform after 2015. The current usage metrics is available 48-96 hours after online publication and is updated daily on week days.
Initial download of the metrics may take a while.