Fig. 7
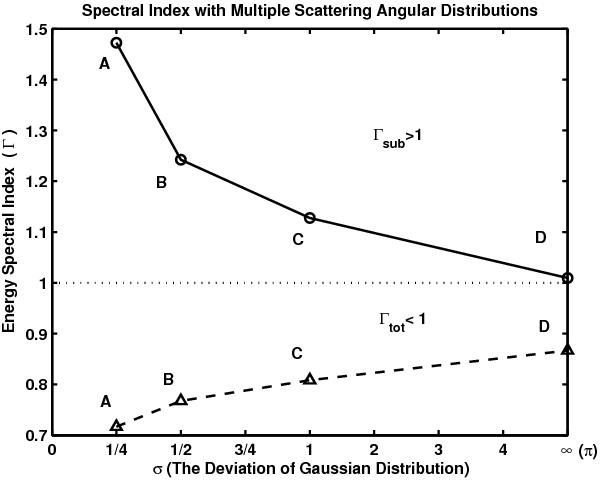
The correlation of the deviation value of the Gaussian distribution vs the energy spectral index. The triangles represent the total energy spectral index in each case. The circles indicate the subshock’s energy spectral index in each case. From Cases A to D, all of the values of the subshock’s energy spectral index Γsub > 1 show a slightly harder power-law slope in the respective order. From Cases A to D, all of the values of the total energy spectral index Γtot < 1 show a slightly decreasing deviation from the power-law slope in the respective energy spectrum.
Current usage metrics show cumulative count of Article Views (full-text article views including HTML views, PDF and ePub downloads, according to the available data) and Abstracts Views on Vision4Press platform.
Data correspond to usage on the plateform after 2015. The current usage metrics is available 48-96 hours after online publication and is updated daily on week days.
Initial download of the metrics may take a while.