Fig. 6
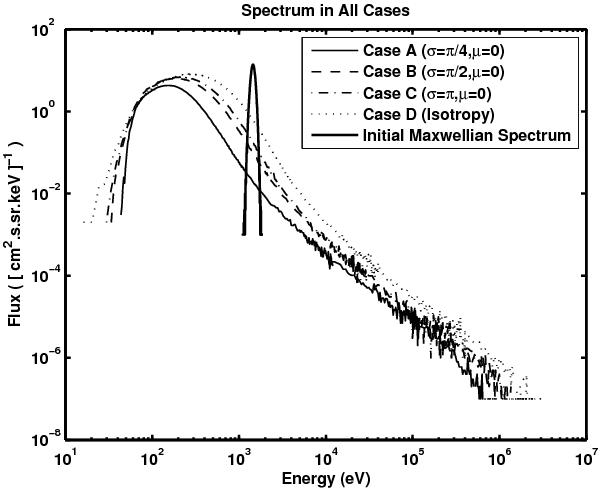
The final energy spectrum in the four cases and the initial energy spectrum plots. The thick solid line with a narrow peak at E0 = 1.3105 keV represents the initial Maxwell energy distribution. The solid, dashed, dot-dashed, and dotted extended curves indicate the simulated particles’ energy spectral distribution, averaged over the entire downstream region, at the end of the simulations (Tmax = 2400), corresponding to Cases A, B, C, and D, respectively. Most particles cross the shock only once, producing the large broad peak centered at EA ~ 0.05 keV, EB ~ 0. 1 keV, EC ~ 0.15 keV, and ED ~ 0.20 keV in Cases A, B, C, and D, respectively. However, some particles gain enough energy via the Fermi acceleration mechanism to produce the “power-law” tail in the energy spectrum with the cutoff at EA = 1.10 MeV, EB = 2.41 MeV, EC = 2.98 MeV, and ED = 4.01 MeV corresponding to Cases A, B, C, and D. All these energy spectra are plotted in the same shock frame.
Current usage metrics show cumulative count of Article Views (full-text article views including HTML views, PDF and ePub downloads, according to the available data) and Abstracts Views on Vision4Press platform.
Data correspond to usage on the plateform after 2015. The current usage metrics is available 48-96 hours after online publication and is updated daily on week days.
Initial download of the metrics may take a while.