Fig. 5
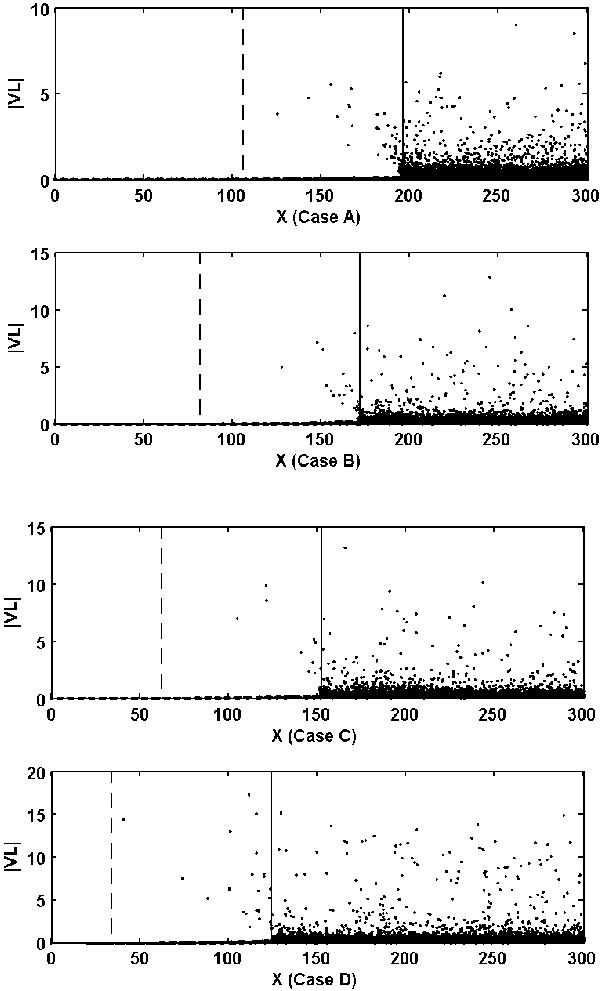
The scatter plots of the particle’s thermal velocities in the local frame vs. its position at the end of the simulations (Tmax = 2400), and the vertical dashed line and solid line in each plot indicate the approximate position of the FEB and shock front, respectively. Only the ratio of 1/12 of the total number of particles are plotted.
Current usage metrics show cumulative count of Article Views (full-text article views including HTML views, PDF and ePub downloads, according to the available data) and Abstracts Views on Vision4Press platform.
Data correspond to usage on the plateform after 2015. The current usage metrics is available 48-96 hours after online publication and is updated daily on week days.
Initial download of the metrics may take a while.