Fig. 4
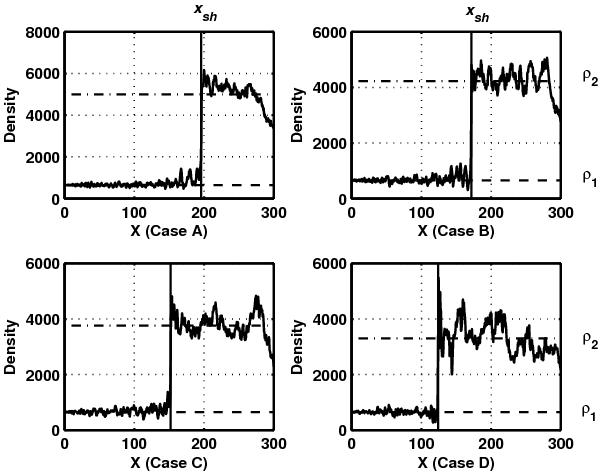
Density profiles in an entire simulation box at the end of the simulation (Tmax = 2400) in the four cases. The vertical solid line is located in the position of the shock front, the upper horizontal dot-dashed line represents the value of the downstream density ρ2, and the lower horizontal dashed line indicates the value of the upstream density ρ1 in each plot.
Current usage metrics show cumulative count of Article Views (full-text article views including HTML views, PDF and ePub downloads, according to the available data) and Abstracts Views on Vision4Press platform.
Data correspond to usage on the plateform after 2015. The current usage metrics is available 48-96 hours after online publication and is updated daily on week days.
Initial download of the metrics may take a while.