Fig. 3
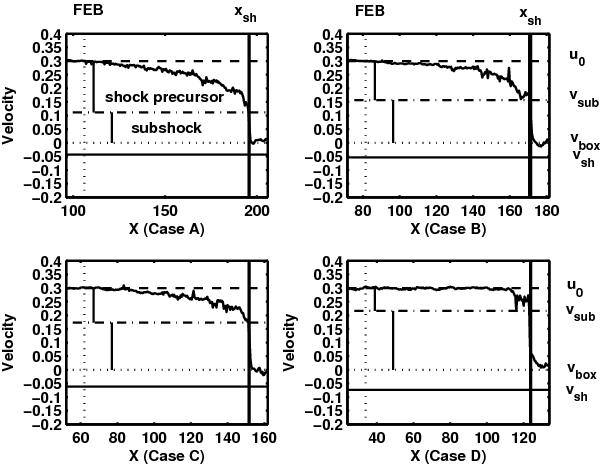
Velocity profiles in the shock region at the end of the simulation (Tmax = 2400) in the four cases; the vertical solid and dotted lines indicate the shock front and FEB in each plot, respectively; the horizontal solid, dotted, dot-dashed and dashed lines show the values of the shock velocity vsh, velocity of box frame vbox, subshock velocity vsub and initial bulk velocity U0, respectively. Two vertical bars in each plot represent the two deflections of velocity, the upper bar represents the part of the shock precursor and the lower one represents the subshock.
Current usage metrics show cumulative count of Article Views (full-text article views including HTML views, PDF and ePub downloads, according to the available data) and Abstracts Views on Vision4Press platform.
Data correspond to usage on the plateform after 2015. The current usage metrics is available 48-96 hours after online publication and is updated daily on week days.
Initial download of the metrics may take a while.