Fig. 6
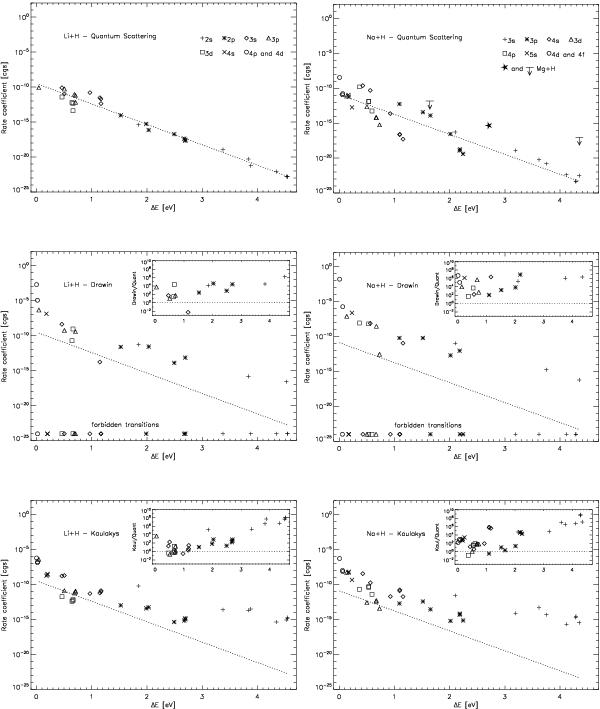
Rate coefficients at 6000 K from various calculations for excitation transitions between the lowest 9 states of Li and Na due to H atom collisions, plotted against the transition energy. The panels in the left column are for Li+H, and in the right column Na+H. In each panel, different symbols are used to denote the initial state of the transition following the key given in the upper panels. The upper panels show the results from detailed quantum scattering calculations (Barklem et al. 2003, 2010), noting there are no results for Li n = 4 initial states as the data for these transitions were deemed unreliable. The dotted line shows a linear fit to the these data, which is repeated in the lower two panels to aid comparison. The upper panel in the right column also shows the limited data now available for Mg+H calculated from cross sections given in Guitou et al. (2011). Note that the data for the two transitions to the 3p 1P° state should be interpreted as upper limits; however, they are probably not more than an order of magnitude or two lower. No data for Mg+H are plotted in the other panels. The middle panels show the results of the Drawin formula, and the insets show the ratio with the quantum scattering calculations. Forbidden transitions, where the Drawin formula is not applicable, are shown in the bottom of the panels. The lower panels show the results of the Kaulakys free electron model (Kaulakys 1991), and the insets show the ratio with the quantum scattering calculations.
Current usage metrics show cumulative count of Article Views (full-text article views including HTML views, PDF and ePub downloads, according to the available data) and Abstracts Views on Vision4Press platform.
Data correspond to usage on the plateform after 2015. The current usage metrics is available 48-96 hours after online publication and is updated daily on week days.
Initial download of the metrics may take a while.