Free Access
Fig. 9
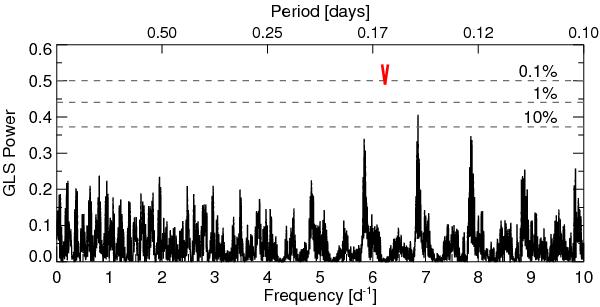
GLS periodogram of the residual RV ⋆ data after subtraction of the sinusoidal fit. The red arrow marks the position of the 0.16 d period, which is no longer present, as well as its corresponding aliases. The new peak with the highest power at 0.14 d has a FAP of 3.4% and is therefore insignificant.
Current usage metrics show cumulative count of Article Views (full-text article views including HTML views, PDF and ePub downloads, according to the available data) and Abstracts Views on Vision4Press platform.
Data correspond to usage on the plateform after 2015. The current usage metrics is available 48-96 hours after online publication and is updated daily on week days.
Initial download of the metrics may take a while.