Free Access
Fig. 6
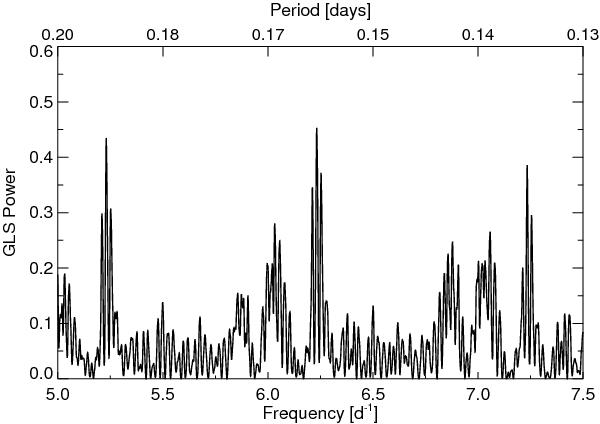
Close-up view of the GLS centered around the most significant peak at 0.16 d. Two less significant peaks at 5.230 d-1 and 7.234 d-1 are present in addition and are aliases caused by the sidereal day. All three peaks show side lobes with a difference of 0.021 d-1 in frequency, caused by the uneven sampling of our data.
Current usage metrics show cumulative count of Article Views (full-text article views including HTML views, PDF and ePub downloads, according to the available data) and Abstracts Views on Vision4Press platform.
Data correspond to usage on the plateform after 2015. The current usage metrics is available 48-96 hours after online publication and is updated daily on week days.
Initial download of the metrics may take a while.