Fig. 5
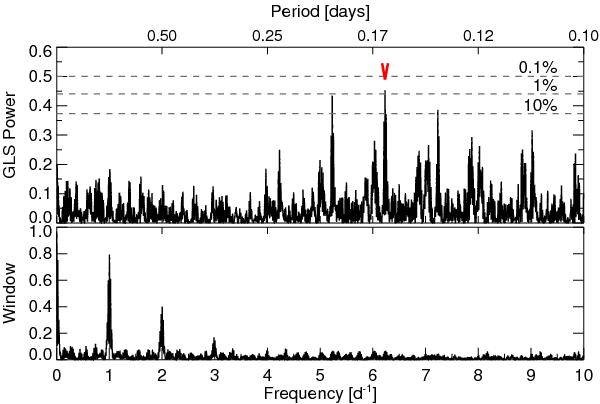
GLS periodogram (upper plot) and window function (lower plot) of the RV ⋆ data. The significant period at 0.16 d is marked by the red arrow. FAP thresholds for 0.1%, 1%, and 10% are indicated by the horizontal dashed lines. The data are plotted over frequency but the upper x-axis gives the corresponding period. Note that periods greater than 1 d are in the frequency range between 0 and 1 d-1.
Current usage metrics show cumulative count of Article Views (full-text article views including HTML views, PDF and ePub downloads, according to the available data) and Abstracts Views on Vision4Press platform.
Data correspond to usage on the plateform after 2015. The current usage metrics is available 48-96 hours after online publication and is updated daily on week days.
Initial download of the metrics may take a while.