Fig. 12
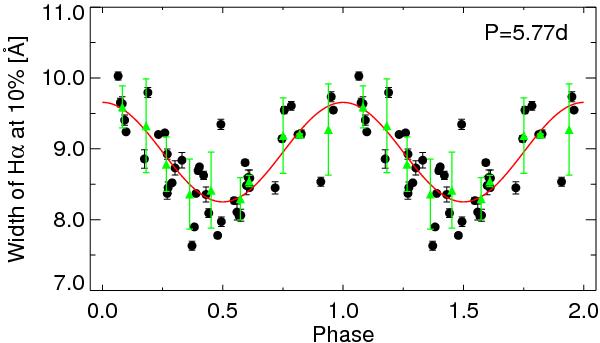
Phase-folded plot of the data. The solid line is a sinusoidal fit with a period of 5.77 ± 0.02 d and an amplitude of 0.70 ± 0.08 Å. The green triangles are the average values computed by binning the phase in 0.1 wide bins. Their error bars are derived by computing the standard deviation of the corresponding values in each bin.
Current usage metrics show cumulative count of Article Views (full-text article views including HTML views, PDF and ePub downloads, according to the available data) and Abstracts Views on Vision4Press platform.
Data correspond to usage on the plateform after 2015. The current usage metrics is available 48-96 hours after online publication and is updated daily on week days.
Initial download of the metrics may take a while.