Free Access
Fig. 10
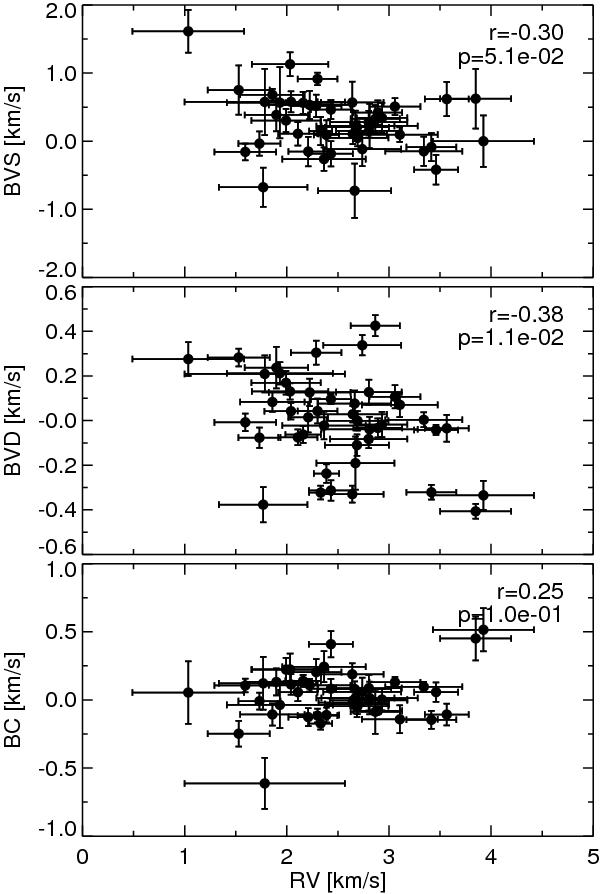
Bisector quantities versus RV ⋆ . For each plot, the linear correlation coefficient r and the probability p that the data are linearly uncorrelated are computed (Bevington & Robinson 2003). There is no linear correlation between the bisector quantities and RV ⋆ .
Current usage metrics show cumulative count of Article Views (full-text article views including HTML views, PDF and ePub downloads, according to the available data) and Abstracts Views on Vision4Press platform.
Data correspond to usage on the plateform after 2015. The current usage metrics is available 48-96 hours after online publication and is updated daily on week days.
Initial download of the metrics may take a while.