Fig. 8
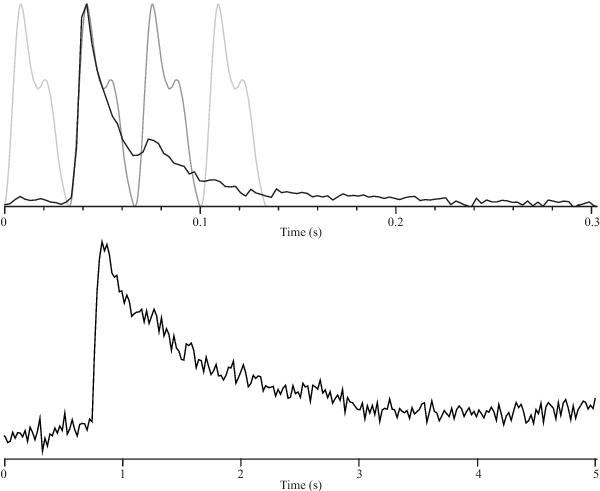
Observations of giant pulses from PSR B0531+21 in the Crab Nebula observed with both the HBA and LBA. The top panel shows a “double giant” pulse observed using the incoherent sum of the HBAs from 6 core stations over the frequency range 139–187 MHz. A section of the timeseries data (black line) is shown indicating a giant pulse which is followed by a second giant pulse in the next rotation of the pulsar. The fading grey lines show the average pulse profile for this observation repeated four times. The two giant pulses clearly show the influence of scattering in the ISM and from the Crab Nebula itself. The lower panel shows a single giant pulse observed with the LBAs from 17 core stations added incoherently over the range 32–80 MHz. Note the significantly different timescale for the scattering delay compared with the HBA observation.
Current usage metrics show cumulative count of Article Views (full-text article views including HTML views, PDF and ePub downloads, according to the available data) and Abstracts Views on Vision4Press platform.
Data correspond to usage on the plateform after 2015. The current usage metrics is available 48-96 hours after online publication and is updated daily on week days.
Initial download of the metrics may take a while.