Fig. 2

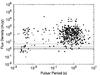
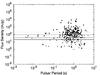
Sensitivity curves for 600-s observations using the HBAs (left) and the LBAs (right) with a bandwidth of 48 MHz, compared to the extrapolated flux densities of 787 known pulsars at 150 and 50 MHz respectively. Flux densities were determined using, if known, 100 MHz fluxes from Malofeev et al. (2000) (circles) otherwise fluxes at either 400 MHz (triangles) or 1400 MHz (diamonds) (Manchester et al. 2005), whichever were available, were used and scaled to 150 MHz using a known spectral index or a typical spectral index of − 1.8 (squares). All of these flux densities were scaled by  , where W is the effective pulse width and P is the period of the pulsar, to incorporate broadening of the profile by scattering in the ISM. W was determined by combining the pulse width at high frequencies with the broadening due to scattering in the ISM, based on the model of Bhat et al (2004). If W > 0.75P then the pulsar was deemed undetectable. It was assumed that broadening of the profile due to uncorrected dispersive smearing was negligible. MSPs are shown by the open symbols and “normal” pulsars by filled symbols. The lines in both cases correspond to the sensitivity of a single international station (fine dashed line), the incoherent sum of 20 core stations (heavy dashed line), incoherent sum of all LOFAR stations (filled line) and the coherent sum of 20 core stations (bold line).
Current usage metrics show cumulative count of Article Views (full-text article views including HTML views, PDF and ePub downloads, according to the available data) and Abstracts Views on Vision4Press platform.
Data correspond to usage on the plateform after 2015. The current usage metrics is available 48-96 hours after online publication and is updated daily on week days.
Initial download of the metrics may take a while.