Fig. 2
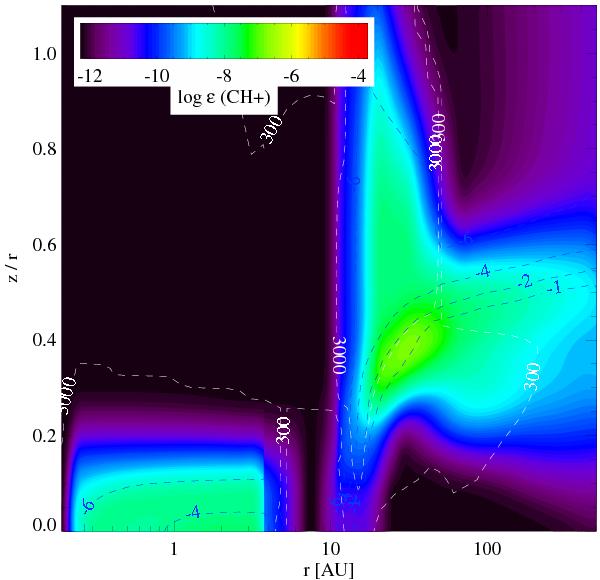
CH+ abundance structure in the HD 100546 disc with respect to the number of H-nuclei. The H2 abundance relative to total H-nuclei abundance contours in log-scale are overplotted in blue, while the Tgas = 300 and 3000 K contours are overplotted in white. The line-of-sight CH+ observations in the UV would cross the disc at z/r = 0.9 (42°).
Current usage metrics show cumulative count of Article Views (full-text article views including HTML views, PDF and ePub downloads, according to the available data) and Abstracts Views on Vision4Press platform.
Data correspond to usage on the plateform after 2015. The current usage metrics is available 48-96 hours after online publication and is updated daily on week days.
Initial download of the metrics may take a while.