Fig. 1
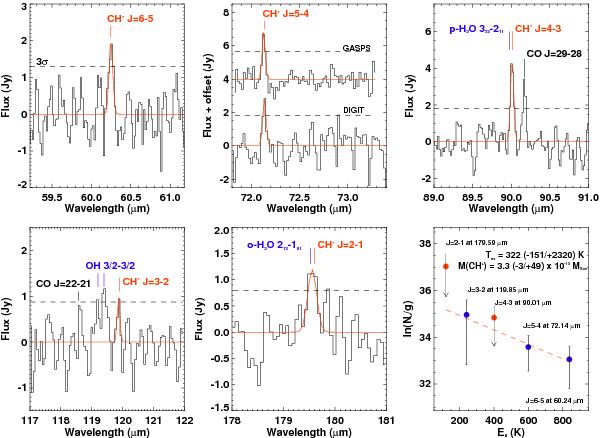
Continuum-subtracted Herschel-PACS spectra of HD 100546 around the CH+J = 6−5, 4−3, 3−2, 2−1 (DIGIT data), and J = 5−4 (GASPS and DIGIT data) lines. The 3σ statistical error levels do not include the 30% calibration uncertainty. A rotational diagram using those transitions is plotted in the lower-right panel. The errors in the diagram are the quadratic sum of all the statistical and calibration errors ( ). Blended lines are considered as upper limits (red filled dots).
Current usage metrics show cumulative count of Article Views (full-text article views including HTML views, PDF and ePub downloads, according to the available data) and Abstracts Views on Vision4Press platform.
Data correspond to usage on the plateform after 2015. The current usage metrics is available 48-96 hours after online publication and is updated daily on week days.
Initial download of the metrics may take a while.