Free Access
Fig. 4
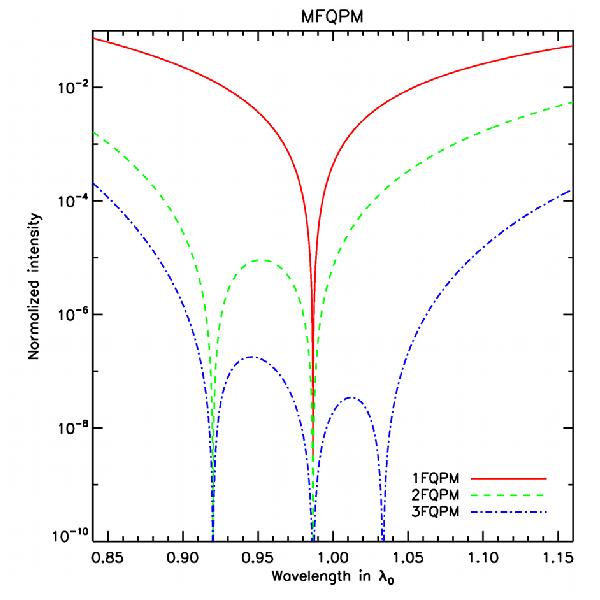
Residual energy spectra after one (red full line), two (green dashed line), and three (blue dashed-dotted line) monochromatic FQPM. The curves are normalized to the non-coronagraphic case.
Current usage metrics show cumulative count of Article Views (full-text article views including HTML views, PDF and ePub downloads, according to the available data) and Abstracts Views on Vision4Press platform.
Data correspond to usage on the plateform after 2015. The current usage metrics is available 48-96 hours after online publication and is updated daily on week days.
Initial download of the metrics may take a while.