Free Access
Fig. 11
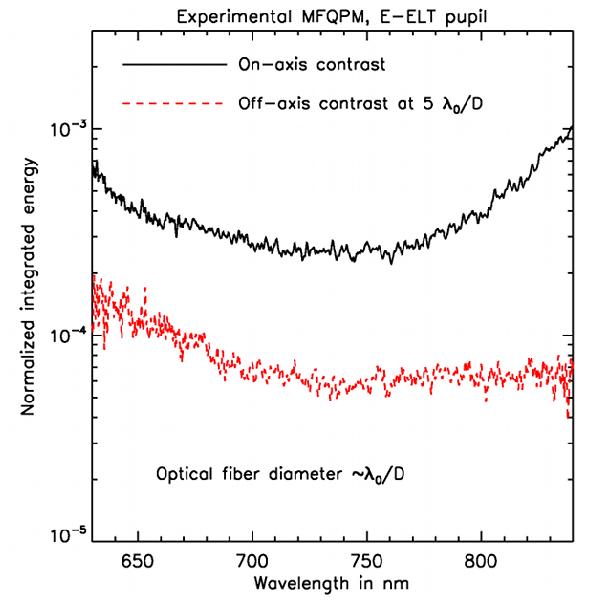
Experimental residual energy spectral evolution integrated by the spectrometer fiber on the optical axis (black full line) and at 5 λ0/D (red dashed line) in MFQPM focal plane with E-ELT pupil. The curves are normalized to the non-coronagraphic case.
Current usage metrics show cumulative count of Article Views (full-text article views including HTML views, PDF and ePub downloads, according to the available data) and Abstracts Views on Vision4Press platform.
Data correspond to usage on the plateform after 2015. The current usage metrics is available 48-96 hours after online publication and is updated daily on week days.
Initial download of the metrics may take a while.