Fig. 9
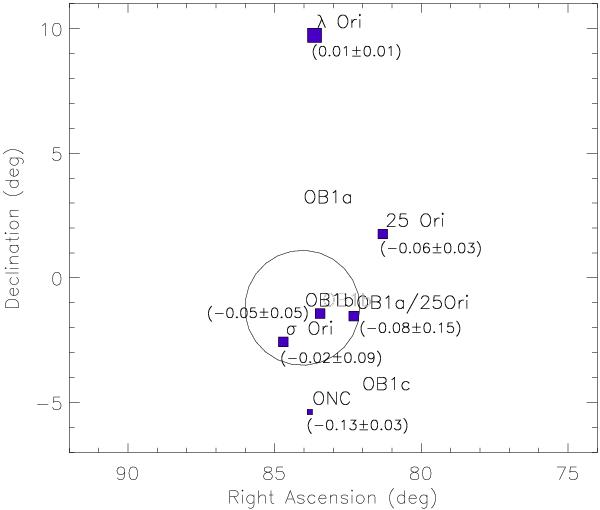
Iron-abundance distribution of members of the Orion complex (ONC, OB1b, OB1a, σ Ori, 25 Ori, and λ Ori) taken from the most recent literature (González-Hernández et al. 2008; Biazzo et al. 2011) and this work. Symbols with different sizes denote three different metallicity bins: [Fe/H] ≤ −0.10, −0.09 ≤ [Fe/H] ≤ 0.00, and [Fe/H] > 0.00, from the smallest to the largest sizes. The central bin corresponds to the average metallicity of the Orion complex ± 1σ. The mean metallicity of each subgroup is written in parenthesis. The circle outlines the Briceño et al. (2005) boundary of the Orion OB subgroups.
Current usage metrics show cumulative count of Article Views (full-text article views including HTML views, PDF and ePub downloads, according to the available data) and Abstracts Views on Vision4Press platform.
Data correspond to usage on the plateform after 2015. The current usage metrics is available 48-96 hours after online publication and is updated daily on week days.
Initial download of the metrics may take a while.