Fig. 7
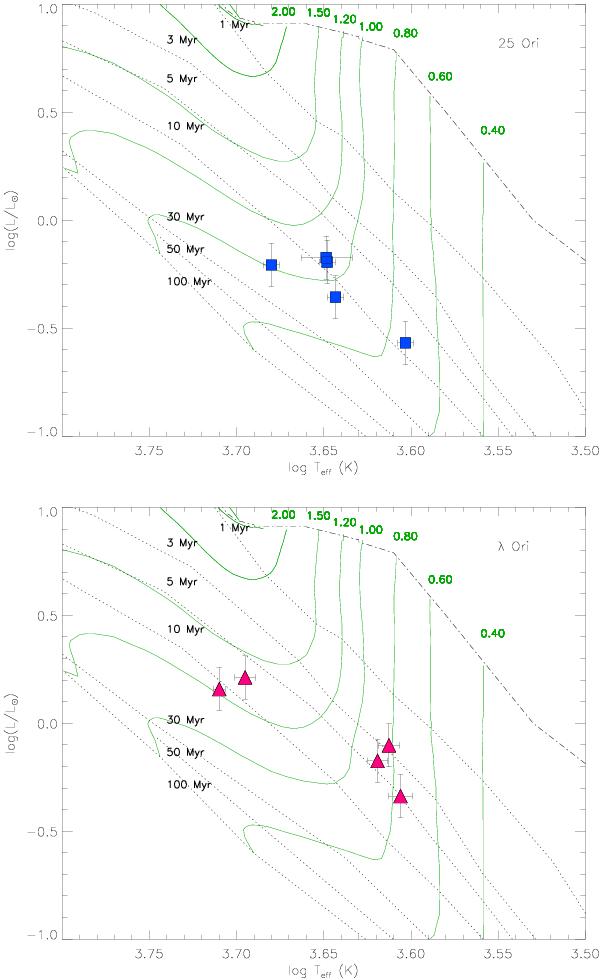
HR diagram of the members of 25 Ori (upper panel; squares) and λ Ori (lower panel; triangles) where the abundance analysis was done. The Palla & Stahler (1999) PMS evolutionary tracks are displayed with the labels representing their masses (solid lines). Similarly, the birthline and isochrones (from 1 to 100 Myr) are shown with dash-dotted and dotted lines, respectively.
Current usage metrics show cumulative count of Article Views (full-text article views including HTML views, PDF and ePub downloads, according to the available data) and Abstracts Views on Vision4Press platform.
Data correspond to usage on the plateform after 2015. The current usage metrics is available 48-96 hours after online publication and is updated daily on week days.
Initial download of the metrics may take a while.