Fig. 9
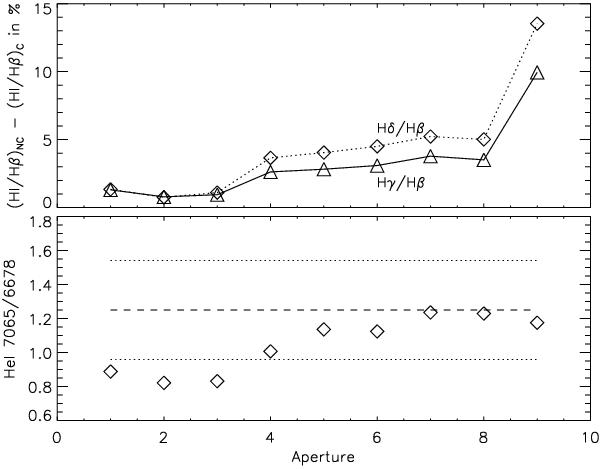
Upper panel: difference between the non-extinction-corrected Hγ/Hβ and Hδ/Hβ ratios from the C and NC spectra (see text for explanation). Lower panel: He i 7065/6678 line ratio from the NC spectra (9 apertures). The mean and standard deviation values corresponding to the bright Huygens region (obtained from data by O’Dell & Harris 2010) are also indicated as a dashed and dotted lines, respectively.
Current usage metrics show cumulative count of Article Views (full-text article views including HTML views, PDF and ePub downloads, according to the available data) and Abstracts Views on Vision4Press platform.
Data correspond to usage on the plateform after 2015. The current usage metrics is available 48-96 hours after online publication and is updated daily on week days.
Initial download of the metrics may take a while.