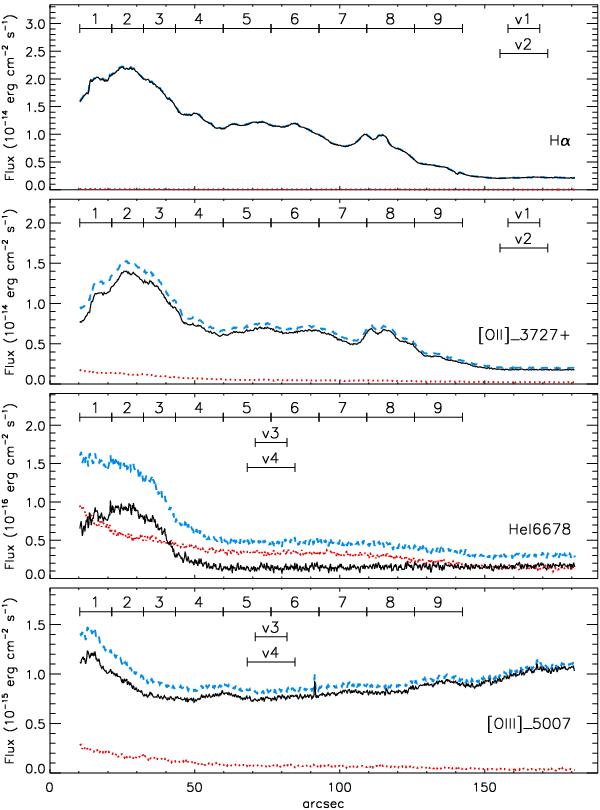
Fig. 8

Spatial distribution of the nebular emission in four selected nebular lines (Hα, [O ii] λλ3720+30, He i λ6678, and [O iii] λ5007) and their respective adjacent nebular continua, obtained from the ISIS-WHT spectroscopic observations. The colored lines represent the measured line fluxes (blue), the adjacent continuum emission (red), and the continuum-subtracted line fluxes (black). The apertures used to extract nebular spectra at different distances from the central star are also indicated (see Sect. 5.2). Apertures labeled as v1, v2, v3, and v4, are those used to correct the other nine apertures for the contamination by the extended emission component.
Current usage metrics show cumulative count of Article Views (full-text article views including HTML views, PDF and ePub downloads, according to the available data) and Abstracts Views on Vision4Press platform.
Data correspond to usage on the plateform after 2015. The current usage metrics is available 48-96 hours after online publication and is updated daily on week days.
Initial download of the metrics may take a while.


