Fig. 7
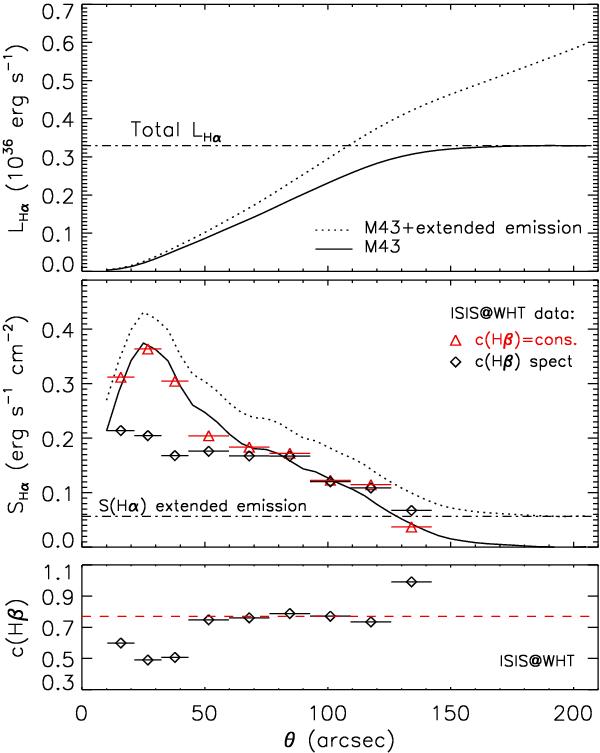
Top and middle panels: integrated Hα luminosity profile and extinction corrected Hα surface brightness profile, respectively, obtained from the nebular image. Bottom panel: reddening coefficient obtained from the empirical analysis of the nebular spectra (see Sect. 5). In the upper panels we compare the L(Hα) and S(Hα) profiles of the original images (dotted lines) with those of images corrected for the contribution of the extended emission (solid lines). Some data obtained from the ISIS-WHT spectroscopic observations are also included as triangles and diamonds (see text for explanation).
Current usage metrics show cumulative count of Article Views (full-text article views including HTML views, PDF and ePub downloads, according to the available data) and Abstracts Views on Vision4Press platform.
Data correspond to usage on the plateform after 2015. The current usage metrics is available 48-96 hours after online publication and is updated daily on week days.
Initial download of the metrics may take a while.