Fig. 6
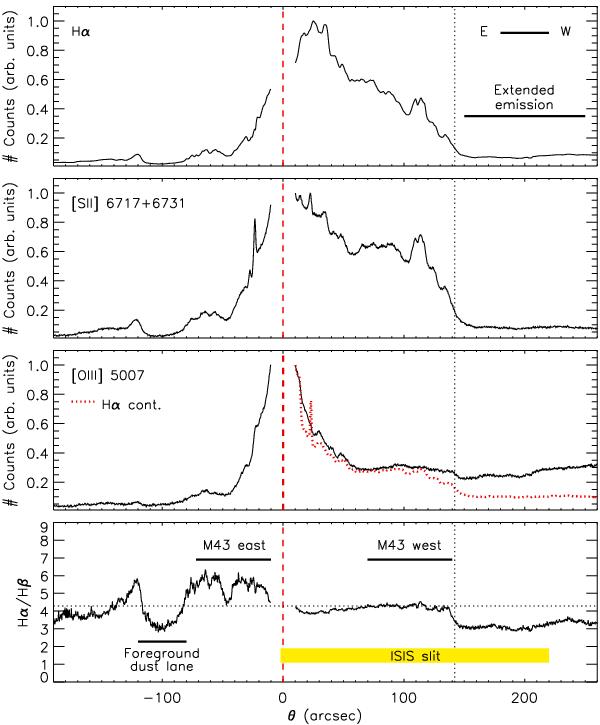
Three upper panels: spatial distribution of Hα, [S ii] λλ6716+30, and [O iii] λ5007 emission in a line passing by HD 37061 in the west-east direction (see Fig. 2), obtained from the corresponding WFC-INT images. The dashed red line indicates the position of HD 37061. The vertical dotted line indicate the western limit of M 43. Bottom panel: Hα/Hβ spatial distribution in the same line direction. Some dust features outlined by Smith et al. (1987) and the position and size of the ISIS-WHT slit are indicated. Horizontal dotted lines show the Hα/Hβ value in the M 43 west region.
Current usage metrics show cumulative count of Article Views (full-text article views including HTML views, PDF and ePub downloads, according to the available data) and Abstracts Views on Vision4Press platform.
Data correspond to usage on the plateform after 2015. The current usage metrics is available 48-96 hours after online publication and is updated daily on week days.
Initial download of the metrics may take a while.