Fig. 3
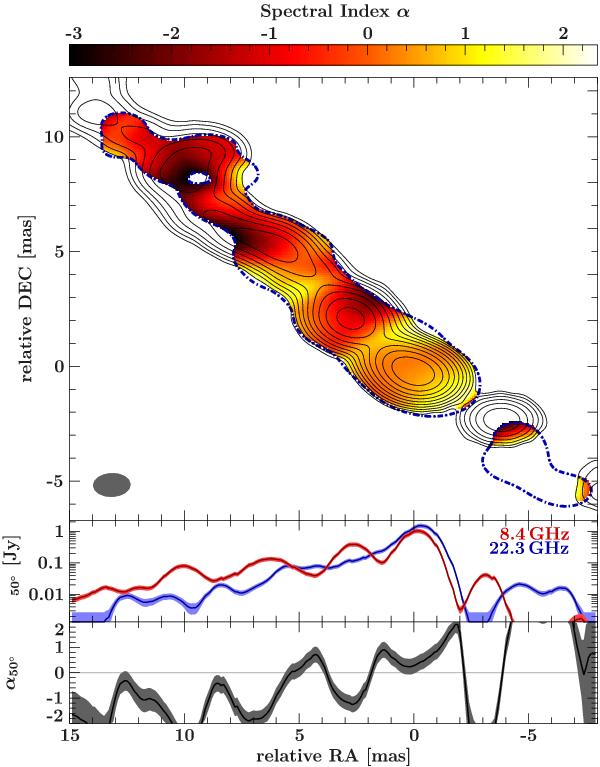
Top: spectral index map derived from the flux densities at 8.4 GHz and 22.3 GHz. The flux density distribution at 8.4 GHz is shown in solid black contours. The dashed blue contour shows the 3σ-noise level at 22.3 GHz. Both maps have been restored with a beam of 1.61 × 1.02 mas (θ = 88°) represented by the gray ellipse in the lower left corner. Middle: Flux density distribution at 8 GHz (red) and 22.3 GHz (blue) for a narrow strip of 0.1 mas along the jet at a PA = 50° corrected for the shift of Δα = −0.25 mas and Δδ = −0.2 mas. Bottom: spectral index given by the flux densities at PA = 50°. Uncertainties corresponding to the absolute calibration uncertainties and on-source errors of ~ 15% and considering the image rms at both frequencies are shown as shaded regions around the best-fit distributions (solid lines).
Current usage metrics show cumulative count of Article Views (full-text article views including HTML views, PDF and ePub downloads, according to the available data) and Abstracts Views on Vision4Press platform.
Data correspond to usage on the plateform after 2015. The current usage metrics is available 48-96 hours after online publication and is updated daily on week days.
Initial download of the metrics may take a while.