Free Access
Fig. 8
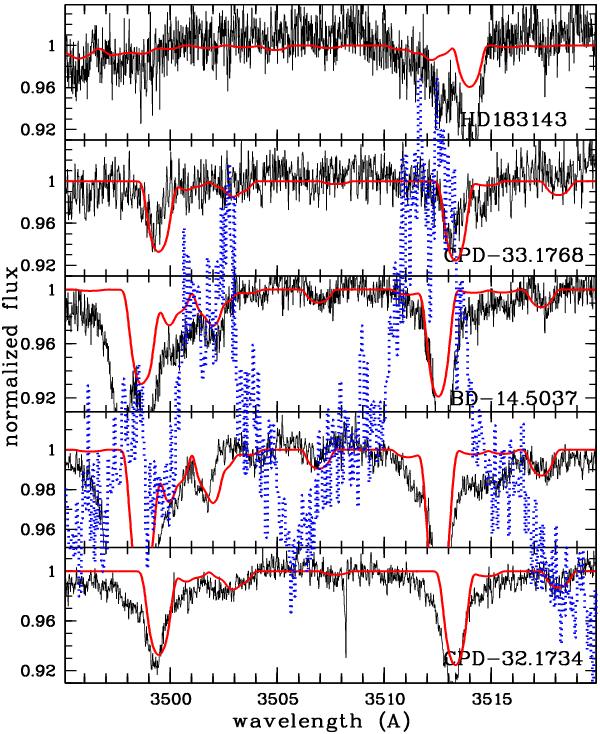
Comparison of laboratory data of benzo[ghi]perylene (dotted blue curve) with UVES spectra of our programme stars. The laboratory spectrum shows two vibrational bands in the S2 ← S0 transition (Tan & Salama 2005). See Fig. 4 for further details.
Current usage metrics show cumulative count of Article Views (full-text article views including HTML views, PDF and ePub downloads, according to the available data) and Abstracts Views on Vision4Press platform.
Data correspond to usage on the plateform after 2015. The current usage metrics is available 48-96 hours after online publication and is updated daily on week days.
Initial download of the metrics may take a while.