Fig. 4
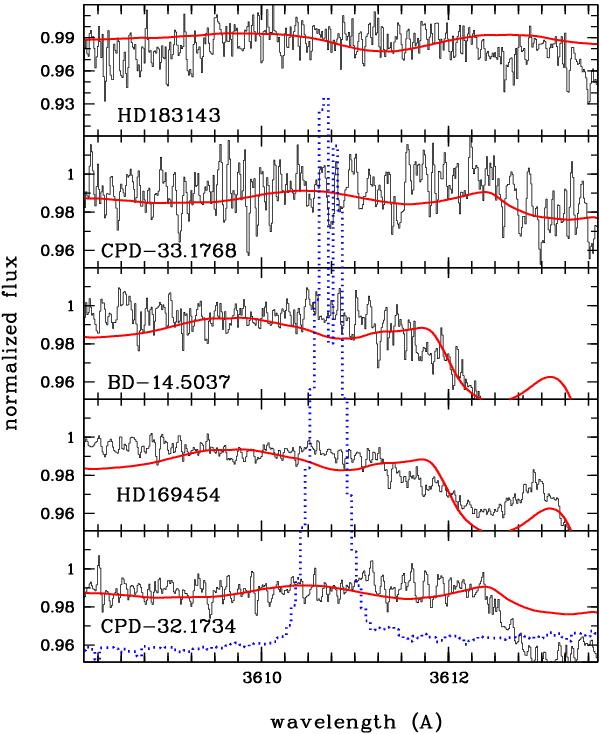
Comparison between the S1 ← S0 origin band of anthracene measured in our laboratory (plotted as dotted blue curve), Staicu et al. (2004) and the UVES spectra obtained toward our programme stars. Red continuous lines represent synthetic stellar spectra obtained from the models of Gummersbach & Kauffer (1993). All stellar spectra have been rebinned to a wavelength frame where the detected interstellar absorption lines occur at an average radial velocity of 0 km s-1, compared with the respective rest wavelengths in air.
Current usage metrics show cumulative count of Article Views (full-text article views including HTML views, PDF and ePub downloads, according to the available data) and Abstracts Views on Vision4Press platform.
Data correspond to usage on the plateform after 2015. The current usage metrics is available 48-96 hours after online publication and is updated daily on week days.
Initial download of the metrics may take a while.