Fig. 11
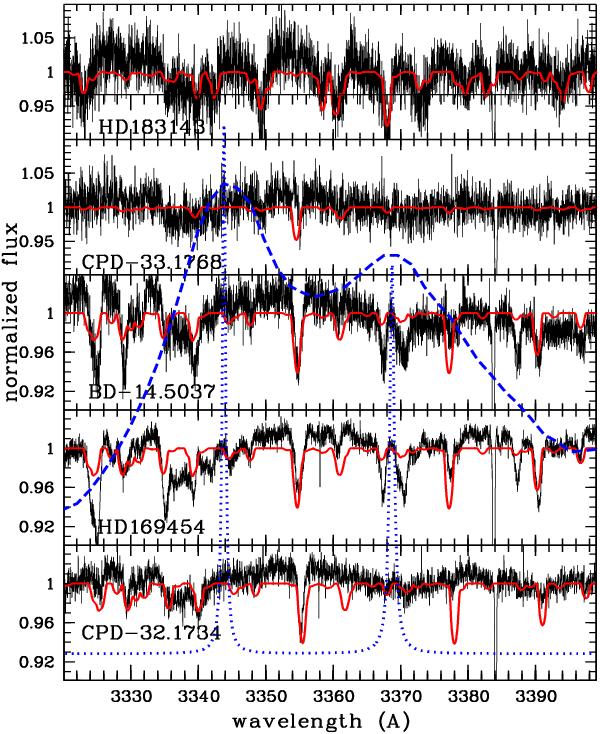
UVES spectra covering the region where the strongest absorption peaks in the Sβ ← S0 transition of hexabenzocoronene are expected. The dashed blue curve represents the hexabenzocoronene spectrum as measured in an Ne matrix and shifted to the expected gas phase position following the method described in Sect. 2.2. The two narrow bands, plotted as dotted blue curve, are synthetic low-temperature gas phase profiles drawn at their predicted gas phase positions (see text). The sharp absorption feature at 3384 Å is due to interstellar Ti ii. See Fig. 4 for further details.
Current usage metrics show cumulative count of Article Views (full-text article views including HTML views, PDF and ePub downloads, according to the available data) and Abstracts Views on Vision4Press platform.
Data correspond to usage on the plateform after 2015. The current usage metrics is available 48-96 hours after online publication and is updated daily on week days.
Initial download of the metrics may take a while.