Free Access
Fig. 4
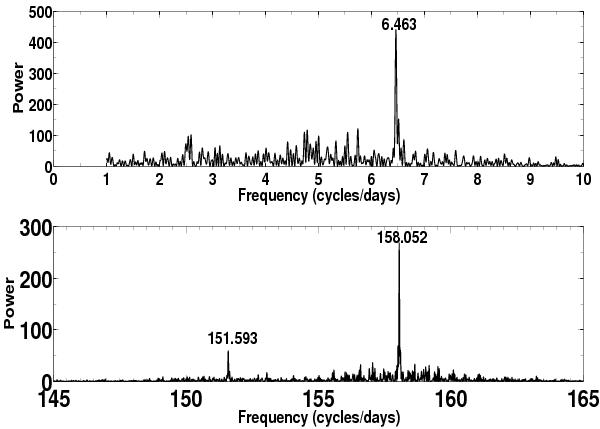
Segments of the high-resolution (27-night) power spectrum, showing that the light curve is dominated by three periodic signals, flagged with their frequency in cycles/day (± 0.002). The low frequency is apparently the beat (“orbit”) of the two high frequencies (“spin” and “sideband”).
Current usage metrics show cumulative count of Article Views (full-text article views including HTML views, PDF and ePub downloads, according to the available data) and Abstracts Views on Vision4Press platform.
Data correspond to usage on the plateform after 2015. The current usage metrics is available 48-96 hours after online publication and is updated daily on week days.
Initial download of the metrics may take a while.