Fig. 3
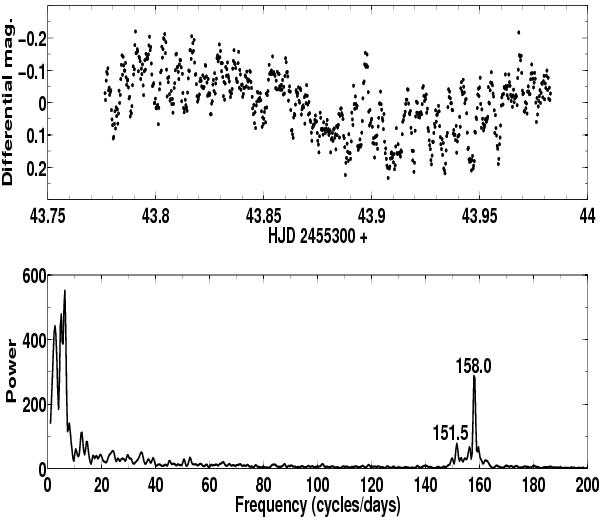
Upper frame: a sample nightly light curve, at 24 s/point. A nine minute pulse of varying amplitude is visible. In retrospect, the amplitude changes appear to be almost entirely caused by the beating of the signals closely spaced in frequency. Lower frame: average power spectrum of the eight best nights, revealing periodic signals, flagged with their frequency in cycles/day (with ± 0.2 errors). The broad excess of power near 155 c/d is entirely owing to the varying power-spectrum window of the eight nightly time series.
Current usage metrics show cumulative count of Article Views (full-text article views including HTML views, PDF and ePub downloads, according to the available data) and Abstracts Views on Vision4Press platform.
Data correspond to usage on the plateform after 2015. The current usage metrics is available 48-96 hours after online publication and is updated daily on week days.
Initial download of the metrics may take a while.