Fig. 2
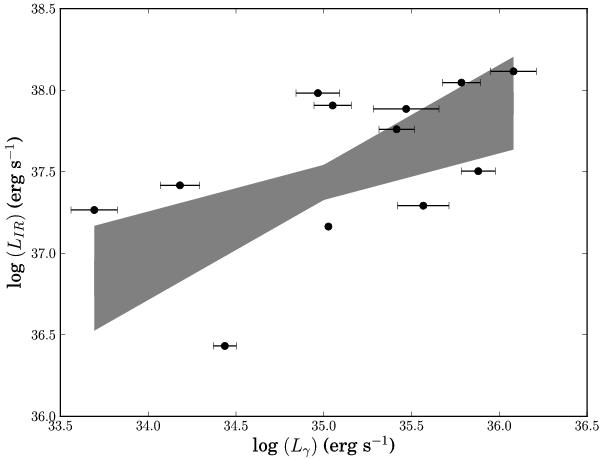
IR luminosity versus gamma-ray luminosity above 100 MeV of the brightest YSOs coincident with each Fermi source. The shaded area represents the 1-σ confidence interval of a least square fit taking eight data points randomly and repeating the fit one thousand times. It can be roughly seen that the higher the gamma-ray luminosity, the higher the IR luminosity.
Current usage metrics show cumulative count of Article Views (full-text article views including HTML views, PDF and ePub downloads, according to the available data) and Abstracts Views on Vision4Press platform.
Data correspond to usage on the plateform after 2015. The current usage metrics is available 48-96 hours after online publication and is updated daily on week days.
Initial download of the metrics may take a while.