Fig. 4
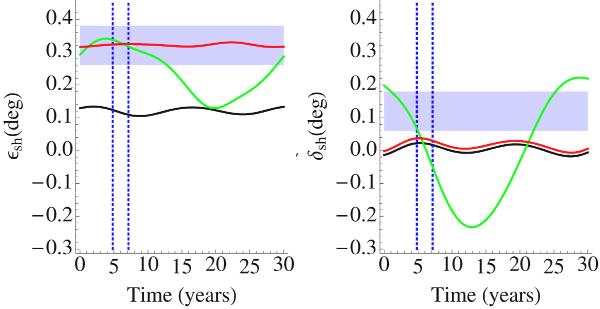
Shell obliquity εsh (left) and deviation δsh (right) over 30 years beginning on J2000 (black for the solid case, red for model 1 and green for model 2). The vertical blue lines show the observation period of Stiles et al. (2008) and the blue boxes represent our estimated obliquity (0.32° ± 3σ) and deviation (0.12° ± 3σ).
Current usage metrics show cumulative count of Article Views (full-text article views including HTML views, PDF and ePub downloads, according to the available data) and Abstracts Views on Vision4Press platform.
Data correspond to usage on the plateform after 2015. The current usage metrics is available 48-96 hours after online publication and is updated daily on week days.
Initial download of the metrics may take a while.