Fig. 3
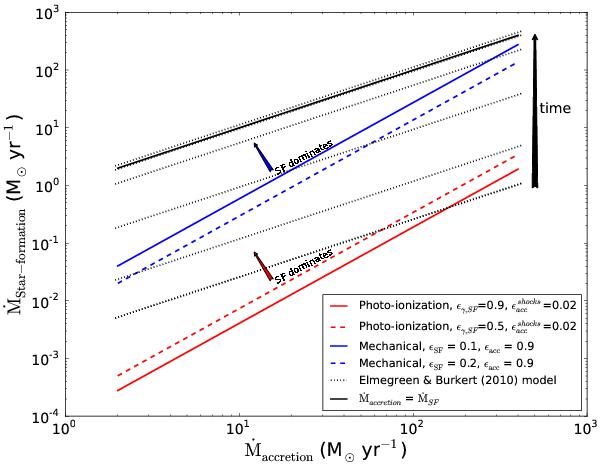
Comparison of the star formation rates and cosmological gas mass accretion rates (in M⊙ yr-1) at which accretion energy generates the same Hα luminosity as young stars through their ionizing photons (red solid and dashed lines) and as mechanical energy released by supernovae and stellar winds (blue lines); the difference between the two sets of lines is the efficiency at which the ionization or mechanical energy output couples to the ISM (see text for details). Both comparisons assume the same accretion model. Regions above the blue and red lines are dominated by the influence of the intense star formation. A comparison with the models by EB10 is also shown for 0.5, 1, 2, 3, 4 and 5 × 90 Myr (from bottom to top, as indicated by the black arrow). The solid black line shows the situation when star formation and cosmological gas mass accretion rates are equal (which the model reaches after a couple of dynamical times).
Current usage metrics show cumulative count of Article Views (full-text article views including HTML views, PDF and ePub downloads, according to the available data) and Abstracts Views on Vision4Press platform.
Data correspond to usage on the plateform after 2015. The current usage metrics is available 48-96 hours after online publication and is updated daily on week days.
Initial download of the metrics may take a while.