Fig. 2
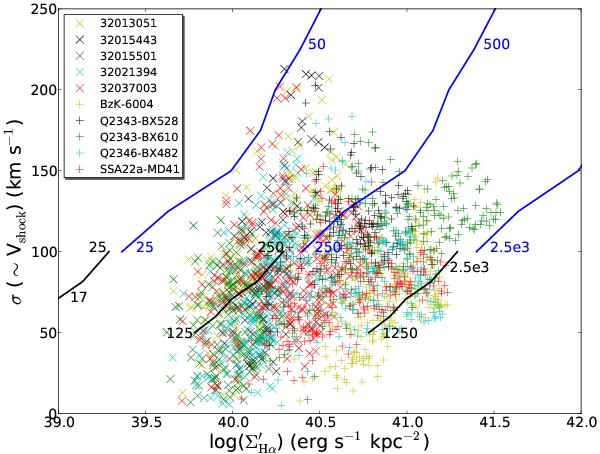
Observed pixel-by-pixel Hα line widths (assumed equal to the shock velocities) as function of Hα surface brightnesses (corrected for cosmological surface brightness dimming) in a sub-sample of 5 representative galaxies in each of two redshift bins, z ~ 1.4 (+ symbols) and z ~ 2.3 ( × ). Lines correspond to Hα surface brightnesses derived using shock models from Raymond (1979) (black) and Allen et al. (2008) (blue). The numbers along each line indicate the surface accretion rates (in M⊙ yr-1 kpc-2) which produce the Hα surface brightness. The 3 sets of lines are for pre-shock densities of 10, 100 and 1000 cm-3, respectively, from left to right.
Current usage metrics show cumulative count of Article Views (full-text article views including HTML views, PDF and ePub downloads, according to the available data) and Abstracts Views on Vision4Press platform.
Data correspond to usage on the plateform after 2015. The current usage metrics is available 48-96 hours after online publication and is updated daily on week days.
Initial download of the metrics may take a while.