Fig. 9
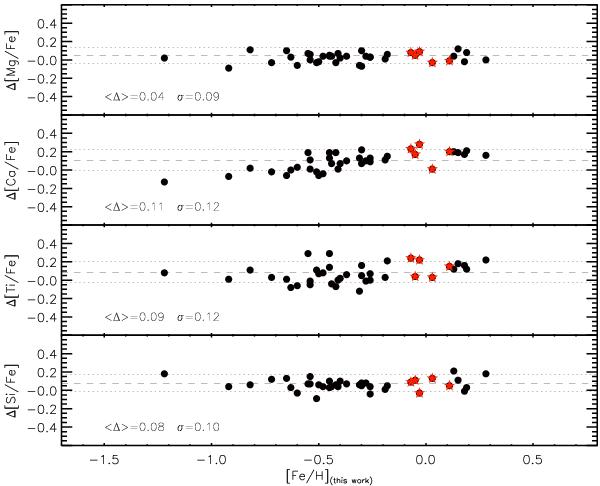
Difference between the [α/Fe] values for Mg, Ca, Ti and Si obtained in this work and the values presented in AB10 calculated as Δ[α/Fe] = [α/Fe]this work − [α/Fe]AB10. The dashed line indicates the mean value of the difference and the dotted lines show the 1σ range for each element. In particular, disk giants used by AB10 to calculate their internal zero points are shown as red filled stars.
Current usage metrics show cumulative count of Article Views (full-text article views including HTML views, PDF and ePub downloads, according to the available data) and Abstracts Views on Vision4Press platform.
Data correspond to usage on the plateform after 2015. The current usage metrics is available 48-96 hours after online publication and is updated daily on week days.
Initial download of the metrics may take a while.