Fig. 3
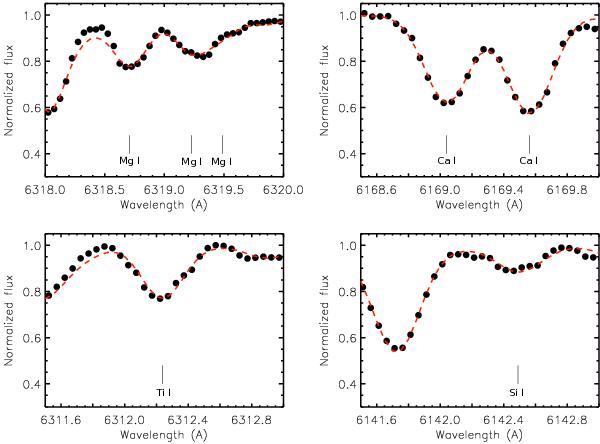
Example of the final output of the synthesis procedure in order to derive the abundances of Mg (upper left), Ca (upper right), Ti (lower left) and Si (lower right). Observed spectrum for target star 212175c6 is plotted as black dots and the red solid line shows the synthetic spectrum using the best fitting abundance as obtained from our procedure.
Current usage metrics show cumulative count of Article Views (full-text article views including HTML views, PDF and ePub downloads, according to the available data) and Abstracts Views on Vision4Press platform.
Data correspond to usage on the plateform after 2015. The current usage metrics is available 48-96 hours after online publication and is updated daily on week days.
Initial download of the metrics may take a while.