Fig. 15
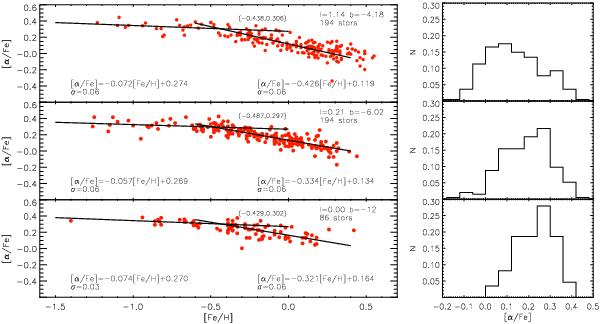
The left panels show [α/Fe] trends as a function of [Fe/H] in 3 bulge fields located along the minor axis. Best fit trends are shown for both [Fe/H] ranges, a metal-poor between −1.2 and −0.5 dex and a metal-rich between −0.3 and 0.2 dex, as well as the location of the knee in all fields. The right panels show the [α/Fe] distribution for each field.
Current usage metrics show cumulative count of Article Views (full-text article views including HTML views, PDF and ePub downloads, according to the available data) and Abstracts Views on Vision4Press platform.
Data correspond to usage on the plateform after 2015. The current usage metrics is available 48-96 hours after online publication and is updated daily on week days.
Initial download of the metrics may take a while.